
Marketing Metrics Calculator
Use this free Marketing Metrics Calculator to calculate CPM, CPC, CTR, CPA, conversion rate and ROAS in one place. Enter your advertising spend, impressions, clicks, conversions and revenue to understand how your campaign performed.
The calculator works with USD, GBP, EUR, QAR and AED. Enter your spend and revenue in the same currency. Your information stays on your device and is not stored by Cultures Connect.
How to Use the Marketing Metrics Calculator
Follow these steps:
- Select the currency used for the campaign.
- Enter the total advertising spend.
- Add the number of impressions.
- Enter the total number of clicks.
- Add the number of conversions.
- Enter the revenue attributed to the campaign.
- Select Calculate marketing metrics.
The calculator will display all the metrics that can be calculated from the information entered. If you leave a required field empty, the related result will display a dash.
Always use figures from the same campaign and reporting period. For example, do not combine one week of advertising spend with one month of revenue.
Marketing Metrics Explained
The Marketing Metrics Calculator measures six important campaign metrics:
- CPM: Cost per 1,000 impressions
- CPC: Cost per click
- CTR: Click-through rate
- CPA: Cost per acquisition or conversion
- Conversion rate
- ROAS: Return on advertising spend
Each metric explains a different stage of the customer journey. CPM measures the cost of visibility, CTR measures the response to the advertisement, and conversion rate shows what happens after people click.
CPA and ROAS help connect campaign activity with business results.
CPM: Cost per 1,000 Impressions
CPM shows how much you paid for every 1,000 ad impressions.
CPM = Advertising spend ÷ Impressions × 1,000
If you spent QAR 1,000 and generated 150,000 impressions, your CPM would be approximately QAR 6.67.
CPM is useful when the main campaign objective is awareness or reach. A lower CPM means you generated impressions at a lower average cost, but it does not confirm that people clicked or converted.
CPC: Cost per Click
CPC shows the average amount paid for each click.
CPC = Advertising spend ÷ Clicks
If you spent QAR 1,000 and received 3,000 clicks, your average CPC would be approximately QAR 0.33.
CPC can help compare the cost of attracting traffic across different advertisements, audiences or platforms. A low CPC is positive only when the traffic is relevant and supports the campaign goal.
CTR: Click-Through Rate
CTR shows the percentage of impressions that resulted in a click.
CTR = Clicks ÷ Impressions × 100
If an advertisement received 3,000 clicks from 150,000 impressions, its CTR would be 2%.
Google defines CTR as the number of clicks an advertisement receives divided by the number of times it is shown. It also notes that a good CTR depends on what is being advertised and the network being used. You can read Google Ads’ official explanation of click-through rate.
CTR can help you assess whether the creative, message and call to action encouraged people to respond. However, a high CTR does not guarantee conversions or sales.
CPA: Cost per Acquisition
CPA shows how much the campaign spent, on average, to generate one conversion.
CPA = Advertising spend ÷ Conversions
If you spent QAR 1,000 and generated 120 conversions, your CPA would be approximately QAR 8.33.
A conversion can be a purchase, lead, registration, booking, download or another valuable action. Define what counts as a conversion before comparing campaign results.
Whether a CPA is profitable depends on the value of the conversion and the costs involved in delivering the product or service.
Conversion Rate
Conversion rate shows the percentage of clicks that resulted in conversions.
Conversion rate = Conversions ÷ Clicks × 100
If 3,000 people clicked and 120 converted, the conversion rate would be 4%.
A low conversion rate can indicate a problem after the click. Possible causes include:
- A slow landing page
- An unclear offer
- A complicated form
- Unexpected costs
- A weak call to action
- A mismatch between the advertisement and landing page
- Traffic from the wrong audience
- Inaccurate conversion tracking
Google Ads calculates conversion rate by dividing conversions by eligible ad interactions, such as clicks or video views. Your platform’s result may therefore differ slightly from this calculator, which uses the clicks you enter. Google Ads explains its conversion calculations here.
ROAS: Return on Advertising Spend
ROAS compares the revenue attributed to a campaign with the amount spent on advertising.
ROAS = Revenue ÷ Advertising spend
If a campaign generated QAR 4,500 from QAR 1,000 in advertising spend, the ROAS would be 4.5×.
This means the campaign generated QAR 4.50 in revenue for every QAR 1 spent on advertising.
A ROAS above 1× means the campaign generated more revenue than its advertising cost. However, this does not automatically mean the campaign was profitable. ROAS does not include costs such as:
- Product production
- Staff
- Shipping
- Agency fees
- Creator fees
- Discounts
- Returns
- Payment-processing fees
- Other operating expenses
A business with high profit margins may be comfortable with a lower ROAS than one with narrow margins.
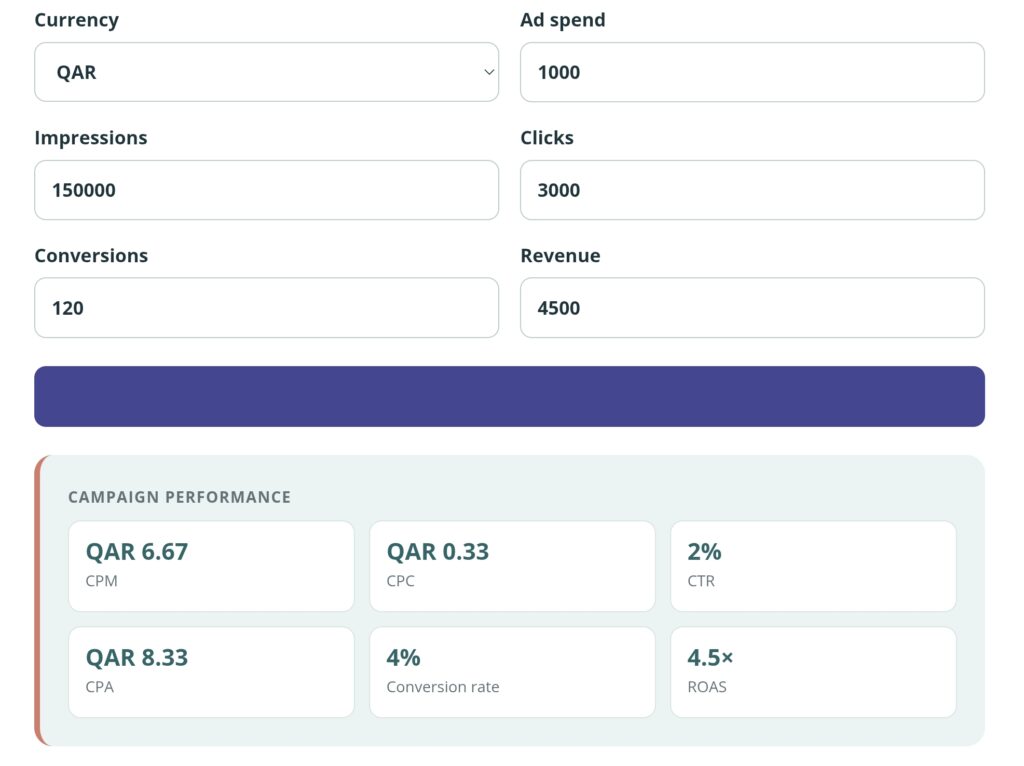
Example Marketing Metrics Calculation
Imagine that a campaign generated these results:
- Ad spend: QAR 1,000
- Impressions: 150,000
- Clicks: 3,000
- Conversions: 120
- Revenue: QAR 4,500
The calculator produces:
| Metric | Result |
|---|---|
| CPM | QAR 6.67 |
| CPC | QAR 0.33 |
| CTR | 2% |
| CPA | QAR 8.33 |
| Conversion rate | 4% |
| ROAS | 4.5× |
These numbers should be interpreted together.
The 2% CTR indicates how frequently impressions produced clicks. The 4% conversion rate shows how frequently those clicks produced the chosen conversion. The CPA explains the cost of each conversion, while ROAS connects the advertising spend with revenue.
How to Interpret Your Results
Avoid judging a campaign using only one metric.
A low CPM can make a campaign look efficient, but the impressions may not produce clicks. A high CTR may indicate an effective advertisement, but those clicks may not convert. A strong ROAS may look profitable until product, staffing and fulfilment costs are included.
Review the results in order:
- Did the campaign reach enough people?
- Did the advertising encourage them to click?
- Did the landing page turn those clicks into conversions?
- Did those conversions generate enough value?
- Did the campaign support the original business objective?
Comparing results with the campaign’s previous performance is usually more useful than comparing them with a general benchmark from a different industry or platform.
Common Marketing Measurement Mistakes
Mixing Different Date Ranges
All figures should cover the same reporting period. Check the dates in your advertising platform, website analytics and sales system.
Mixing Different Currencies
Advertising spend and revenue must use the same currency. Convert one of the amounts before entering it if your advertising account and sales reports use different currencies.
Counting Every Action as a Conversion
Choose actions that support the campaign objective. A page view and a completed purchase should not be treated as equally valuable conversions.
Ignoring Attribution Settings
Different platforms may claim credit for the same conversion. Attribution determines which advertisement, click or channel receives credit for a customer action.
Google Analytics describes attribution as assigning credit to the different touchpoints in a customer’s path to conversion. Review your attribution settings before comparing reports from different platforms.
Looking Only at Platform Data
Advertising platforms show valuable campaign information, but compare it with website analytics, sales records and lead quality where possible.
Treating Revenue as Profit
ROAS uses revenue rather than profit. Include your other costs before deciding whether a campaign was financially successful.
Frequently Asked Questions
Can I calculate only one marketing metric?
Yes. Enter the information required for that metric. For example, enter spend and clicks to calculate CPC. Results that cannot be calculated will display a dash.
What currency should I select?
Choose the currency used for both advertising spend and revenue. The calculator does not convert between currencies.
What should count as a conversion?
A conversion should be an action that supports your campaign goal, such as a purchase, lead, booking, registration or download.
Is a high CTR always good?
Not necessarily. A high CTR means many impressions generated clicks, but those clicks still need to be relevant and produce valuable actions.
Is a low CPC always good?
No. Cheap clicks have limited value if visitors leave immediately or do not convert.
What is the difference between CPA and CPC?
CPC measures the cost of each click. CPA measures the cost of each conversion. CPA evaluates an action that happens after the click.
Is ROAS the same as ROI?
No. ROAS compares revenue with advertising spend. ROI considers profit and may include additional business costs.
Why does my platform show a different result?
Differences can come from attribution settings, conversion windows, eligible interactions, reporting delays, currency conversions and platform-specific definitions.
Does Cultures Connect store my campaign data?
No. The calculations take place on your device. Cultures Connect does not store the figures you enter.
Plan and Improve Your Campaign
Use the Social Media Campaign Budget Calculator to divide your budget between content production, influencers, advertising and other campaign expenses.
If your campaign includes creators, calculate their performance with the Influencer Engagement Rate Calculator.
You can also explore how campaigns build attention through our guide to creating a buzzworthy campaign around major cultural events.
For more resources, visit the Cultures Connect marketing tools or explore The Pop Culture → Brand Strategy Playbook.